Overview of accessibility in relation to visual content:
- We want someone using AT to get the same information as someone who is not using AT.
- Quick examples: describing images and avoiding things only understood visually.
Design with Accessibility in Mind:
- Do what you can and follow best practices in the authoring tool to avoid eventual issues.
- You can use text styles in most authoring tools, provide alt text to simple graphics, and more.
- Do not use tables for layout purposes.
- Some/most situations will need OCR for searchable text manipulation.
- Can visual content be presented in another way?
Simple example:
- Complicated tables should be written as three individual tables instead of one.
Advanced example:
- Graph as a table.
Two common examples:
Flow charts:
- Tag as images with alt text.
- Tag using heading-level organization.
- Even a list is possible.
- Ask, “Does this make sense and share the same content?” If yes, then you are fine.
Maps:
- Alt text to the entire thing in some scenarios is okay: “United States major highways.”
- Specific info using headings and Figures with Alt text is another great option.
Making Graphic-Heavy Content Accessible
In a world where more and more information is shared electronically and visually, a common question we answer is regarding the accessibility of visual content.
How can we ensure that our documents are accessible to the masses when the information, context, and, in some cases, the text itself, is a visual experience?
Some of the most common examples include flowcharts, maps, and infographics. How can we make this visual content complaint and ensure that the information reaches all intended audiences?
Before we dig into the specifics, it’s important to understand our goals with remediating content and how these goals relate to visual content.
In short, we want people who use assistive technologies to have access to the same information available to someone who is not using these tools.
While the user experience will differ in many cases, the goal is to share information accurately. A few quick examples are adding textual descriptions to images to ensure that someone understands the graphic even if they are not looking at it or avoiding things that are only conveyed visually, such as using colors to indicate something.
Ultimately, this boils down to something we practice and preach as much as possible—design your documents with accessibility in mind. Specifically, do what you can to follow best practices in the authoring tool you are using.
For example, some well-intentioned authors use tables in their files to present text in columns or specific shapes. We should never use tables for layout purposes because they convey inaccurate relationships to readers and can be confusing!
If that author had designed with accessibility in mind, they would have used a built-in column functionality and, therefore, not had to correct the issue in the PDF manually.
Before we explore tangible examples of handling visual elements, it’s worth noting that in some situations, OCR, or Optical Character Recognition, will need to be performed to tag some visual content properly.
For example, if a bar graph happens to be assembled as one big graphic, a remediator may need to run OCR to be able to properly select and tag the numbers or letters from the chart itself. In some cases, OCR is the first step to making visual content accessible as it widens the scope of accessible tagging possibilities.
Is a Graphic the Best Option?
In exploring how to make visual content accessible, a potentially powerful question is, “Can this content be presented in another way?” Considering our goal is to ensure that the reader is given the same information as someone physically looking at the content, it is within our power to make a decision that changes the tag structure and preserves the content.
Imagine this—an author creates a bar graph showing four different bars, each illustrating quantities of a unique item.
While the author undoubtedly made that content visual through the use of the bar chart, would the same information not also be understood through a table? Perhaps it’s four columns, each with the name of the unique item and the corresponding quantity.
This is a critical remediation decision—it drastically changes someone’s perception of the document, sharing a table rather than a bar graph, but, most importantly, it shares the same data in a more digestible and inclusive way.

While that example is exciting, let’s imagine a much simpler one. Rather than having one massive, complicated table with shared column headers and intricate visual organization of three categories, consider making three individual tables. This would share the same content but do so in a more inclusive way that is easier for all audiences to understand and navigate.
With that in mind, we can focus on some common challenges: flowcharts, maps, and infographics.
Flowcharts, Maps, & Infographics
Flowcharts are a frequent way for groups to show organization or structure. They can be a bit daunting for remediators because they seem to progress in multiple directions through multiple different paths. With that in mind, they offer an opportunity for some creative remediation!
Sometimes, we use heading levels to indicate where in the flowchart we are. A Heading 2, or H2, for the top of the chart, and H3, H4, and H5 for the descending levels!
Sometimes, a list is an appropriate option. Perhaps a flowchart has three main “paths.” Each could be tagged as a list, guiding the reader down each path and showing a relationship through list items. The last and sometimes “clunkiest” option is to use figure tags and assign textual descriptions to different content, helping the reading along contextually.
As you can tell, there is flexibility in how we address flowcharts as long as we accurately and accessibly share the information.

Maps are another challenge for remediators. What must the reader know about the map, and how will it be used? Is someone going to use it to actually navigate to a specific location on the map? Or is someone just expected to understand the general idea of the content?
For example, if the map is just used for general information, a remediator could assign Alternate text that reads “Map of United States highways” or whatever the author was trying to convey.
However, if the reader was expected to use the map for navigation, that alternate text would be insufficient to achieve that goal. In situations like this, a remediator can be much more specific as to the contents of the map by using headings for text on the map accompanied by smaller figure tags with alt text for specific sections.
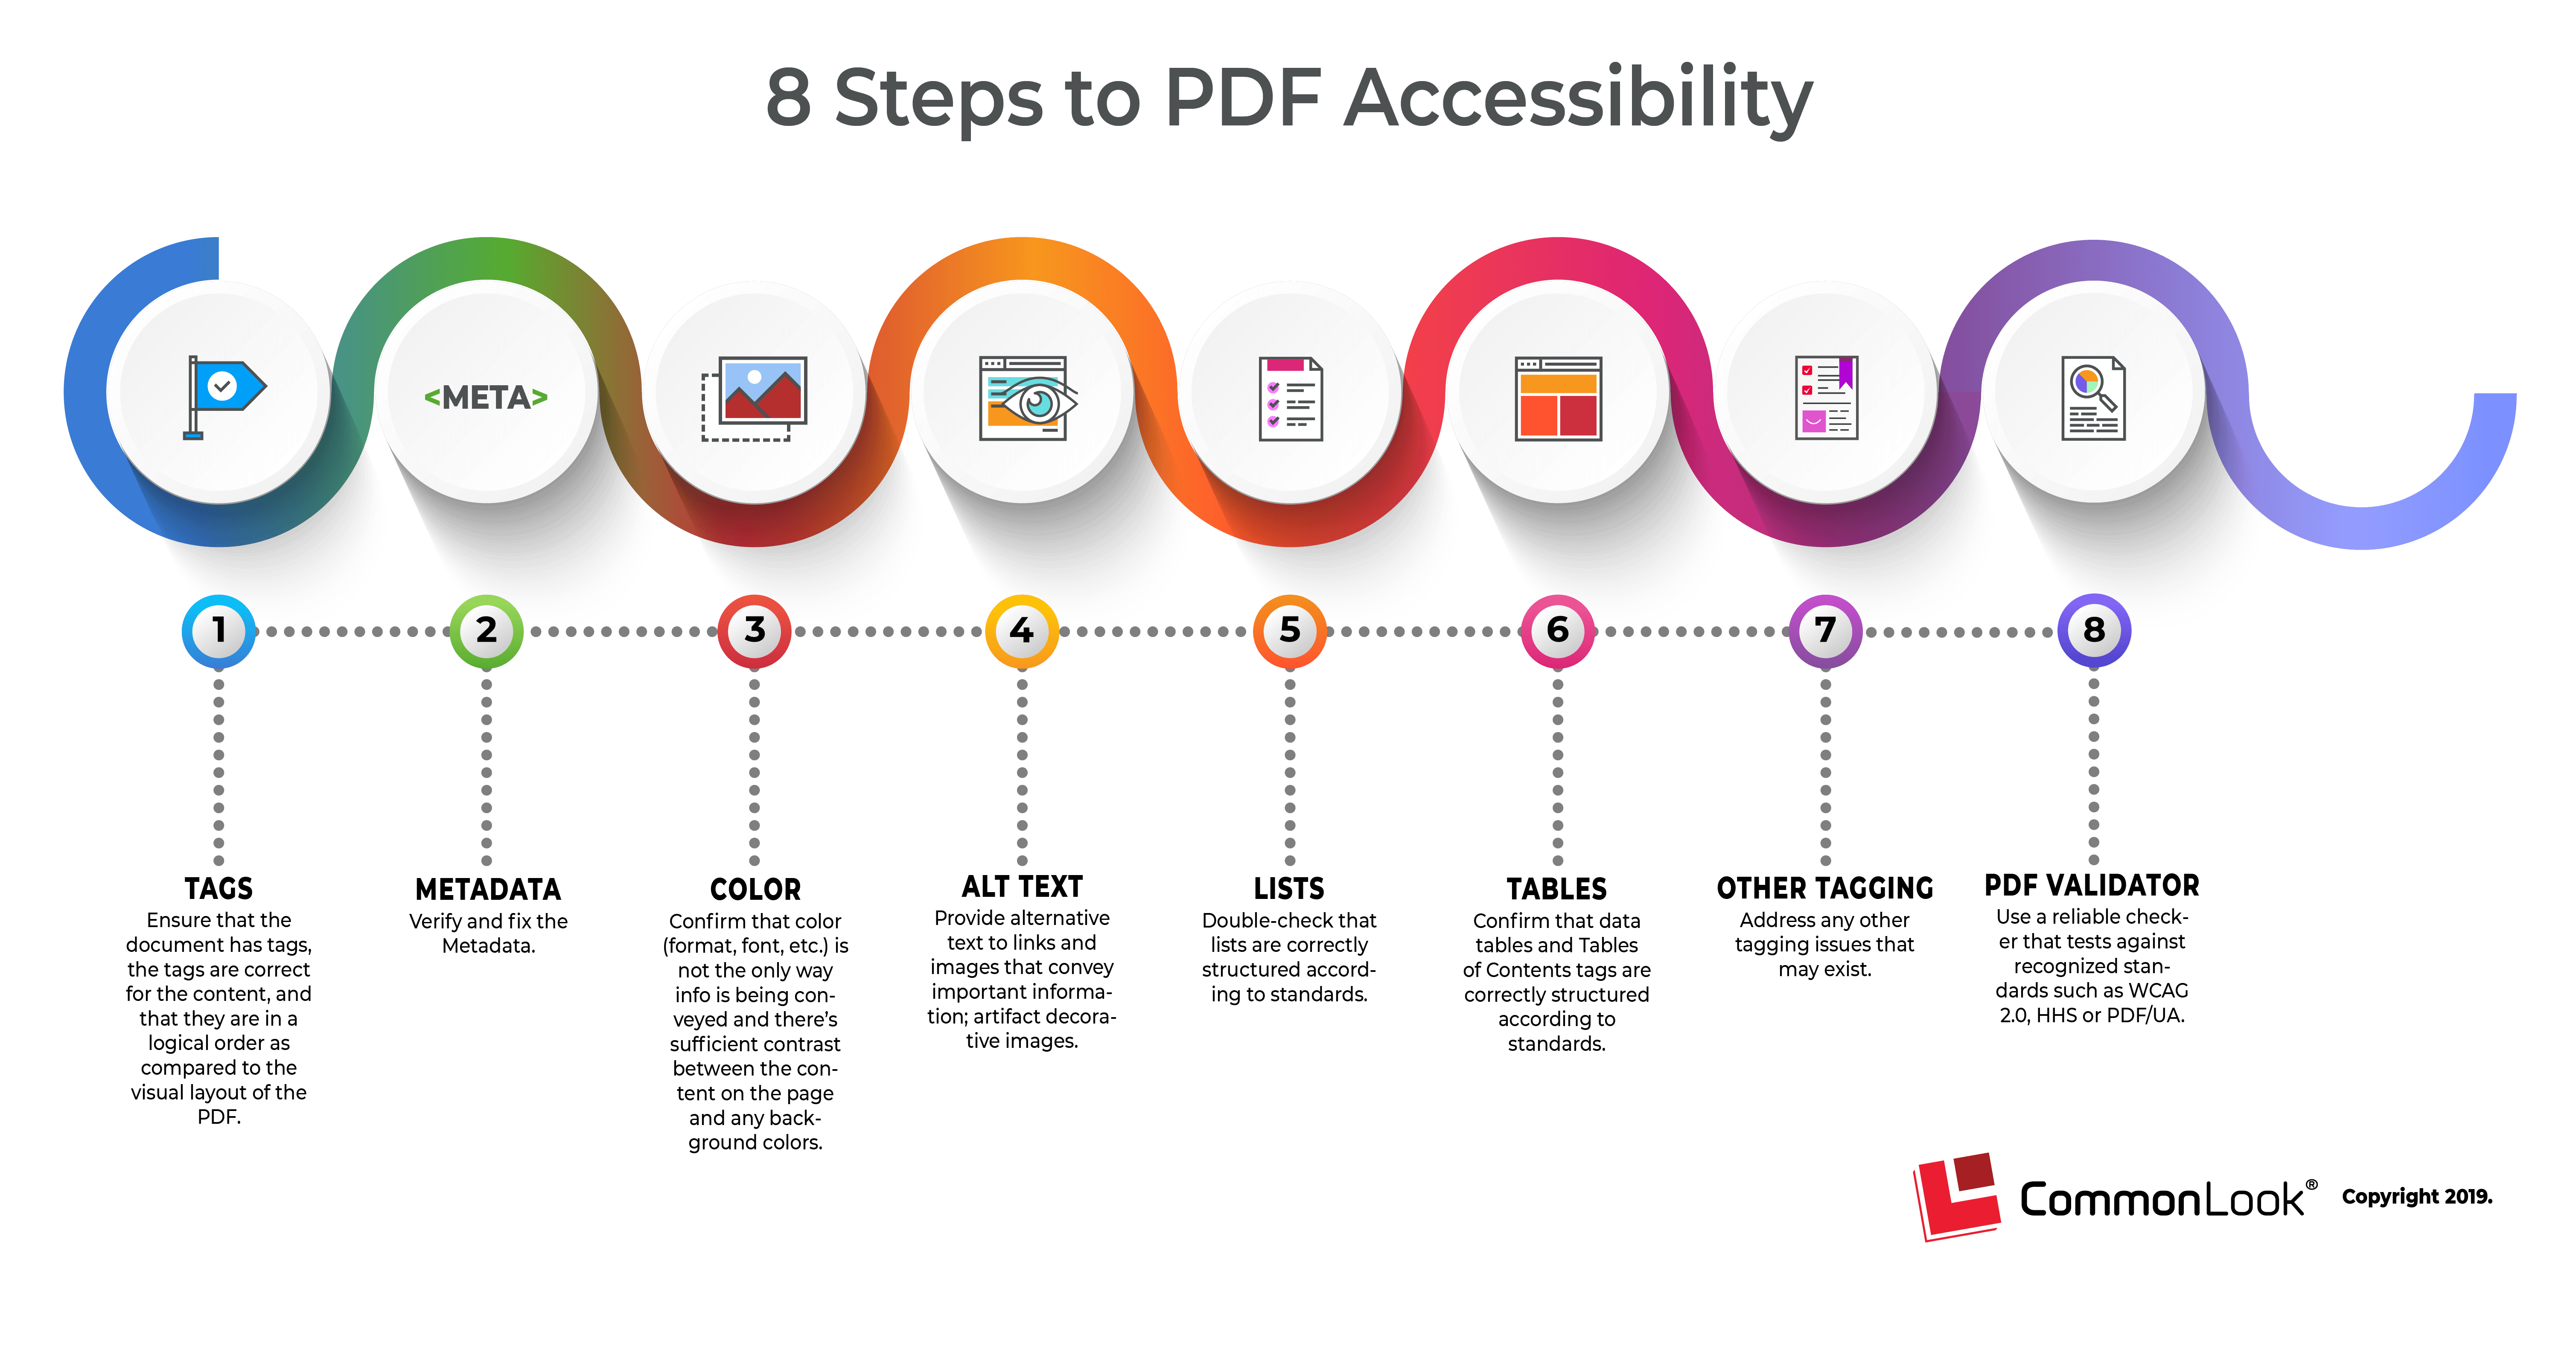
Lastly, infographics are becoming a common but visual method of sharing information while keeping a reader’s attention. While some of these are wildly creative and fun, accessible tagging of infographics is actually more straightforward than the other examples. In short, consider the reading order of the content and place portions of the content into groups for easy organization and progression.
For example, if you are remediating Allyant’s “8 Steps to PDF Accessibility” infographic (see below), consider tagging the content from left to right, organized by each step. Each could have a heading and a paragraph tag, for example.
While every infographic is unique, grouping and reading order are the two main components of ensuring the content is tagged accurately and accessible.

“8 Steps to PDF Accessibility” infographic text: “1., Tags: Ensure that the document has tags, the tags are correct for the content, and that they are in a logical order as compared to the visual layout of the PDF. 2., Metadata: Verify and fix the Metadata. 3., Color: Confirm that color (format, font, etc. is not the only way info is being conveyed and there’s sufficient contrast between the content on the page and any background colors. 4., Alt Text: Provide alternative text to links and images that convey important information; artifact decorative images. 5., Lists: Double-check that lists are correctly structured according to standards. 6., Tables: Confirm that data tables and Tables of Contents tags are correctly structured according to standards. 7., Other Tagging: Address any other tagging issues that may exist. 8., PDF Validator: Use a reliable checker that tests against recognized standards such as WCAG 2.0, HHS or PDF/UA. CommonLook, Copyright 2019.”
While the authoring world continues to make fun, unique, and visual documents, the accessibility world must continue to prioritize comprehensibility and equal access. When faced with visual content, we hope the remediator feels empowered to use some techniques to make the content accessible rather than discouraged by the challenge.

